Web Monitoring Platforms: How Does a Dashboard Work for Your Business?

Web Monitoring Platforms: How Does a Dashboard Work for Your Business?

“We have sensors, we have data — but where do we see it all at once?” That question usually leads to a web monitoring platform. If you wonder what it looks like, how it works, and whether your team will actually use it, here are plain answers — monitoring dashboard, not trade-show jargon.

What is a monitoring platform and what is the dashboard for?

Think of a car dashboard — speed, fuel, warnings — but for the business.

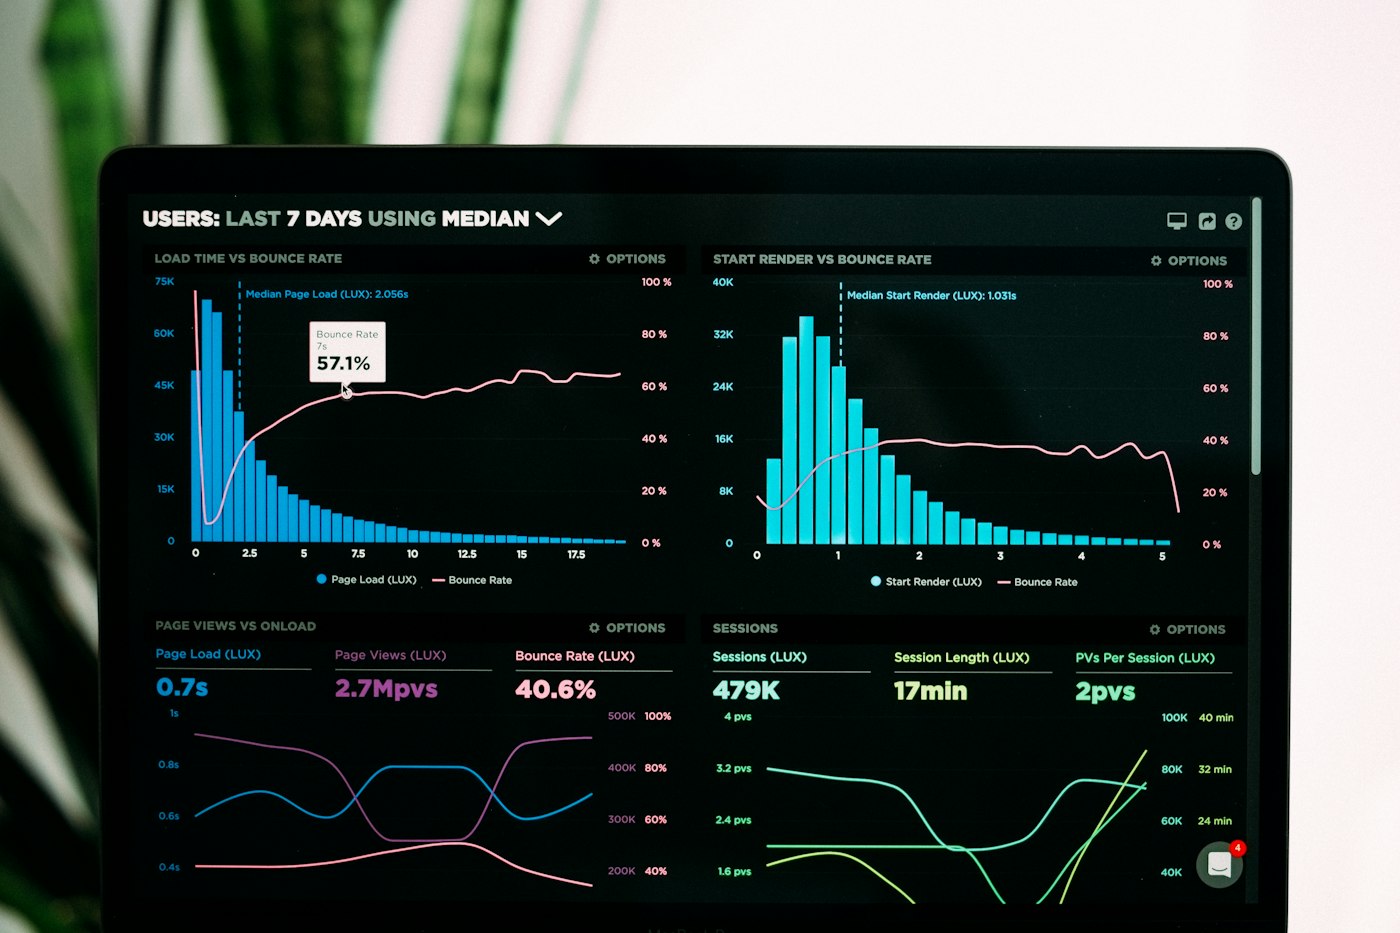
The platform gathers data from sensors, meters, machines, internal apps and shows it in one interface. The dashboard is the main screen:

  • Key indicators — consumption, temperature, uptime, production;
  • Charts — trends over time;
  • Alerts — what needs attention now;
  • Reports — yesterday, last week, last month.

We build personalised panels, not generic templates. A cold store tracks temperature; a factory tracks machines; a utility tracks consumption by zone. Goal: decisions from data, not guesses.

Dashboard with charts and KPIs >
</figure>
<!-- /blog-mid-image -->
<h2>Can I access data on my phone or do I need installed software?</h2>
<p>Phone, tablet, laptop — anywhere you have internet.</p>
<p>It is a <strong>web application</strong>: browser, login, data. Many clients check alerts on mobile first.</p>
<p>Compared with locally installed software:</p>
<ul>
<li><strong>No installs</strong> on every PC;</li>
<li><strong>Central updates</strong> — everyone sees the same version;</li>
<li><strong>Access anywhere</strong> — field, warehouse, travel;</li>
<li><strong>Any OS</strong> — Windows, Mac, Android, iOS.</li>
</ul>
<p>Offline is possible in special cases; for most projects, web is the most practical.</p>
<h2>How hard is it for staff to learn the interface?</h2>
<p>Easier than you think — if it is designed well.</p>
<p>Principle: <strong>each role sees only what they need</strong>. Operator — daily alerts. Manager — reports. Technical director — long trends.</p>
<p>At launch: clean UI, clear labels (English or bilingual), short practical training, support after go-live. Frequent feedback: “We thought it would be complicated. It is simpler than our old Excel.”</p>
<h2>Who configures alerts and reports?</h2>
<p>We set them together initially — thresholds, recipients, frequency. Then you can adjust in the panel (within project limits) or ask our team. Goal: not depend on a developer for every tiny change, but not be alone with something fragile either.</p>
<h2>Questions worth asking before a demo</h2>
<ol>
<li>Can I see a flow similar to my sector (utilities, warehouse, production)?</li>
<li>What do login and roles look like?</li>
<li>PDF/Excel export — automatic or manual?</li>
<li>Where is the platform hosted and who runs backups?</li>
<li>What support exists after launch?</li>
</ol>
<p>A good demo answers: “Can I explain to a colleague what I see here in two minutes?” If not, the interface still needs simplifying.</p>
<h2>Phone vs desktop — same account, same data</h2>
<p>Layout adapts: on mobile you see alerts and key figures; on desktop, charts and exports. No separate app to install — same login, same permissions, which simplifies internal IT support.</p>
<h2>Pretty dashboard vs useful dashboard</h2>
<p>A panel full of colourful charts tires people. A panel with six to eight numbers that matter for your role — stays open every morning. In design we ask: <strong>what decision do you make after seeing this screen?</strong> If the answer is vague, we remove noise.</p>
<h2>Historical data — why not “live only”</h2>
<p>Live is for alerts. History is for supplier negotiations, budget planning, compliance proof. We store data in a structured way, with export, so you are not locked into our UI — the minimum we expect from any serious <strong>web platform</strong>.</p>
<h2>Who should have access?</h2>
<p>Practical rule: dispatch — alerts; management — reports; IT — configuration; finance — periodic export. Too many admins = too many chances to slip. We configure roles at start and adjust when the organisation changes.</p>
<h2>Will it work with our slow internet?</h2>
<p>Web panels load lightweight pages; they are not video streams. If the connection drops, you lose live updates until it returns — historical data stays on the server. For critical alerts we can add SMS or email so you are not tied to refreshing the browser.</p>
<h2>Can we white-label the panel for clients?</h2>
<p>Some utilities or service companies want their logo and colours on the monitoring UI. That is a design and configuration task, not a different product — we plan it early so branding and roles stay consistent.</p>
<h2>One takeaway</h2>
<p>A monitoring platform pays off when someone acts on alerts — not when graphs look pretty. Define who acts, how fast, and on which thresholds before you buy hardware or software.</p>
<p>Integrations matter: if the panel cannot email, export, or talk to your billing tool, you will rebuild spreadsheets anyway. Ask about exports and APIs in the first meeting, not after sign-off.</p>
<p>Training beats feature count: a panel with twelve widgets nobody understands loses to a panel with four numbers everyone trusts. We design for adoption, not demo applause.</p>
<p>Dark mode, large fonts, and simple colour cues help operators in low-light plant floors — small UX choices that reduce mis-clicks when something is actually wrong.</p>
<h2>How IOTNetWEB helps</h2>
<p>We build <strong>web monitoring platforms</strong> tied to IoT, remote reading, warehouses — plus <strong>custom development</strong> when your workflow does not fit a standard box.</p>
<hr />
<p><strong>Want a live example?</strong> <a href=Request a demo — about 30 minutes, matched to your sector, no obligation.

Posted on Aug 06, 2026.